
With Class of 2024 results now coming in on the early admissions round at top colleges and universities around the country, here is our expert assessment on what we’ve learned thus far. We’ll continue to update our information as more schools release their information.
UPS AND DOWNS
Unlike past years that saw big gains in everyone’s early numbers, this year was more of a mixed bag. Brown saw its number of early decision applicants grow by 8 percent, on top of a 21 percent increase in ED last year. Cornell, too, saw its pool grow by 7.4 percent and a news release from the university reminds us that the number of early decision applicants has grown 90 percent over the last decade.
Harvard saw its pool decrease by nearly 8 percent over last year to 6,958 early applicants. The last time Harvard saw its early pool decrease was in the fall of 2013 for applicants to the Class of 2018. Duke’s early decision pool decreased by 552 students (11.4 percent) over last year. Dartmouth’s early decision pool decreased by 16 percentage points over last year to 2,069. Likewise, Penn saw its early decision applicant pool drop by 9 percent from the record level reached last fall.
Natural disasters, school shootings, global economic uncertainty, teacher strikes, and demographic trends are cited by admissions deans as possible explanations for declining early pools. It could also be that savvy students are being more strategic in how they use their early option, aiming for a surer bet rather than going for the long-shot. We’ll continue to monitor these trends and share our perspective as more data are released in the coming months.
WHAT WE KNOW SO FAR
- Diversity of background continues to be a key priority in the selection process. Schools are working actively to build more diversity into their applicant pools through targeted outreach and partnerships with organizations like Questbridge.
- Several schools made particular mention of greater numbers of low income and first-generation college students among the group offered admission. These hooks are clear institutional priorities increasingly supported through the admissions process.
- Both Cornell and Penn are schools that went big for legacy admits, with 22 percent and 24 percent of the ED admits, respectively, being the children of alumni.
- Many schools with binding early decision programs will admit 45-50+ percent of their incoming class through the early process. Doing so ensures that they can lock in a solid foundation for their incoming class and reduce yield volatility.
TOUGHEST SCHOOL TO GET INTO THIS EARLY ROUND?
Based on publicly reported data, the toughest early admission pool this year belonged to MIT. This year, 9,291 students applied for early admission to MIT, and 687 (7%) were offered admission.

Remember for the vast majority of top schools (MIT being the exception), the rate of admission in the early round will be significantly higher than the rate of admission for regular applicants. Duke, for instance, admitted 20% of its early applicants; last year it admitted only 5.7% of its regular decision applicants.
SELECTED EARLY ROUND APPLICANT POOL STATS

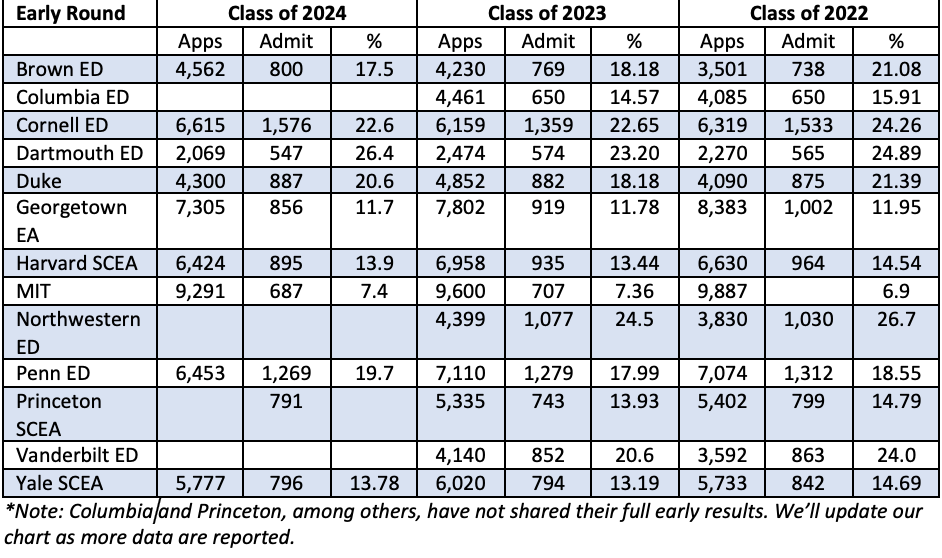
Brown admitted 800 students this December, corresponding to roughly 45 percent of its incoming class. The admitted group represents just 17.5 percent of its 4,562 early decision applicants, making this the most competitive early decision process they’ve ever experienced. The 4,562 students represented an 8 percent increase in volume over last year. Dean of Admissions Logan Powell cites The Brown Promise – a new initiative which replaces all loans in University financial aid packages – as having a major impact on the size and composition of the early pool. 62 percent of those admitted to Brown in early decision applied for financial aid, up from just 50 percent two years ago. Brown continues to push to diversify their student body, which is especially evident in the five percentage point increase in the number of first gen students in the ED admit group (17 percent this year versus 12 percent last year).
For the first time in four years, Cornell’s early decision admit rate increased. The university received 6,615 early decision applicants (a 7 percent increase over the past year’s ED applicant numbers) and admitted 23.8 percent (1,576 students), meaning its admit rate increased by 1.2 percentage points. Those admitted are estimated to comprise 49 percent of the Class of 2024. Interestingly, the number of women admitted this year decreased by four percentage points to 51.4 percent. Hard to know exactly what to make of this statistic—other than perhaps Cornell was concerned that it might be approaching a tipping point with respect to gender balance.
Dartmouth has offered admission to 547 early decision applicants, for an admit rate of 26 percent. The College’s official release notes that the early group includes record percentages of public high school students (54 percent), first-generation students (15 percent), foreign citizens (12 percent), and students of color (35 percent). The children of Dartmouth alumni represent 15 percent of the accepted students and recruited athletes make up 25 percent of the group.
At Duke, 887 students were admitted from a pool of 4,300 early decision applicants. With a drop in early applicants (over 11 percent from the prior year), Duke’s early acceptance rate increased to 21 percent, making this year’s ED process a bit less competitive than the past couple of years. Altogether, these students will comprise 51 percent of the incoming Class of 2024. Students of color comprise 46 percent of those admitted and international students make up another 6 percent.
Harvard saw its early action pool decrease by 7.7 percent, the first time since the fall of 2013 that the university’s early action pool posted a decline. In all, 895 of 6,424 early applicants were offered early admission to the Class of 2024. The 13.9 percent acceptance rate represents a 0.5 percent increase from last year. The early admission acceptance rate has not increased year-over-year since 2013. Dean Fitzsimmons takes a global view to explain the decrease, pointing to everything from wildfires in California (the number of early applicants from California declined nearly 17 percent) to school shootings and economic uncertainty to declining numbers of high school seniors. Women comprise 51.7 percent of the admitted class thus far, slightly more than last year, when women made up 51.3 percent of the early admit class. It seems that Harvard tipped in favor of women who are interested in the physical sciences and computer science. This year, 57.4 percent of admitted students who said they intend to concentrate in the physical sciences are women, compared to 52.9 percent last year and 33 percent the year before. For computer science, 49.1 percent of interested students are women, an increase from 42.9 percent last year, and 29 percent the year before.
Penn admitted 19.7 percent of early decision applicants to the Class of 2024 — breaking nearly a decade of declining ED acceptance rates. Of those who are United States citizens or permanent residents, 52 percent identify as students of a minority group, an increase from 48 percent last year. Similarly, 54 percent of admitted students identified as female, an increase from 51 percent last cycle. 10 percent of admitted students are first-generation college students, a slight decrease from last year’s 11 percent. Of students admitted to the Class of 2024, 24 percent had a parent or grandparent who attended Penn. Last year, 23 percent of admitted students were legacies.
Explaining the drop in ED application volume, Dean Eric Furda in an interview in the student paper seems to suggest a return to “normal” after a “bump” caused by higher scores on the redesigned SAT and students who therefore saw themselves as stronger. He, too, seems to raise the notion that natural disasters, power outages, and teacher strikes impacted the numbers of students applying ED.
Princeton University has offered admission to 791 students in its early pool this year (although the university coyly refrains from telling us how many students applied, suggesting it, too, saw a smaller pool). Of those admitted, 48 percent of students self-identify as students of color, 16 percent are from low income backgrounds, 13 percent are first generation college students, and 11 percent are international students.
Yale’s early application volume also decreased this year to 5,777, down 4 percent from last year’s record-setting pool of 6,020 students. Although short on details about the admitted group, a news release points to an announcement earlier this year from Yale that the past several classes have all set records for socioeconomic diversity, with more than 1,000 undergraduates receiving Federal Pell grants. Of those, more than 600 are in the first-year and sophomore classes. Additionally, the number of students per class who will be the first in their families to graduate from college has increased by 75 percent in the past six years.
Over on the West Coast, there are crickets from Stanford on the details of its early applicant pool and REA admits. The school announced last fall that starting with the Class of 2023, it will stop releasing admissions data until well after the admissions cycle concludes. The change was intended to reduce the “outsized emphasis placed on the admit rates at U.S. colleges and universities,” according to the Stanford news site. “By focusing on the admit rate, talented students who would thrive at Stanford may opt not to apply because they think Stanford seems out of reach,” said Provost Persis Drell.
But, stop the presses, Stanford did just release its overall admissions data for the Class of 2023. Its admit rate fell to a record-low 4.34 percent. Out of a record-high 47,498 applicants to Stanford’s Class of 2023, 2,062 were offered admission.
UPDATE
For two years in a row, Georgetown University has seen its early application volume decrease. This year, 7,305 students submitted early action applications, a decrease of nearly 13 percent since the fall of 2017 when nearly 8,400 students submitted early applications. To be sure, the fact that Georgetown uses a separate – and somewhat cumbersome – application may be a deterrent to students, as is its somewhat unclear testing policies. Georgetown’s Dean of Admissions Charlie Deacon points, instead, to the increased pressure that students feel to choose a binding early decision program (versus a non-binding early action program like Georgetown’s) as the cause of the decrease. In particular, two of Georgetown’s biggest competitors – UVA and BC – both implemented binding early decision programs this year.
Interestingly, Georgetown chose to accept a smaller percentage of its early pool this year – 11.72 percent of early applicants (a record low) were offered admission despite the falling numbers of applicants for the last two years. We wonder why Georgetown chose to do this, especially since Dean Deacon makes a point of highlighting the strength of the pool despite the decreasing numbers of applicants. Could it be looking for the silver lining – “most selective early process yet” – despite the downturn in application volume? If two of your competitors are taking a bigger slice of your market share, wouldn’t you want a slightly larger admit group to help yield the very best students in your early pool?
Stay tuned for more updates as they become available!

In addition, Maria is proud of her long-term volunteer work with Opera North (Lebanon, NH) in fundraising, marketing and audience engagement. She is an avid masters rower with the Upper Valley Rowing Foundation (Hanover, NH) and also serves as a member of its board of directors.
- Class of 2028 Admissions: A Cycle Marked by New Challenges - May 13, 2024
- Global Campuses, Dual Degree and Joint Degree Programs: What You Need to Know - April 29, 2024
- College Admissions: The Year in Review - December 27, 2023

10 replies on “Early Admissions Trends: Class of 2024”
It is important for students and parents to recognize the implications of these numbers and the facts. If you want to attend a competitive top tier school, it is absolutely imperative to apply early decision. Statistically, the odds of getting in later, during the “normal” admission process, drop precipitously – in the case of Dartmouth, students “odds” drop from about 26% chance of success in early admissions to about a 5% chance during the regular admission process. Ouch! 5X harder if you wait. This is purely statistical, so if your student is a legacy or an athlete, or has a unique talent the school values, your mileage will vary, but for most applicants waiting for regular admissions is a far greater risk than I suspect many folks realize. Thanks for sending this important information.
You’re quite welcome!
Unfortunately, the challenge with applying ED, even for extremely competitive students, is that they can’t compare merit aid offers from various schools. If a student knows her family’s income is low enough to qualify for financial aid, ED works. If the student knows her family can afford to pay full tuition + living expenses (upward of $75,000 per year!), ED works. However, if the student’s family is in-between these extremes (they won’t qualify for financial aid and can’t afford $75,000 per year) RD is the only option to be able to compare merit aid packages from multiple universities. One more thing to note: many of the most highly selective schools don’t offer merit aid, only financial aid, making these schools out-of-reach for many extremely high achieveing students.
Though that’s true in part, in our experience, though the Ivies do not give merit aid, they are the MOST generous in need-based financial aid so I would NOT hesitate to apply especially for low income students. Plus (and this is not well understood), if you apply, are accepted, and then financial aid does not work out (you have to appeal first to ask for more), you can get out of the binding ED agreement. Many times the Ivies end up FREE with no loans and if you look at the “cheapest” schools to attend in US News, all the Ivies and top colleges are listed despite the fact they don’t do merit aid. The part you didn’t take into account is how generous and wide reaching their need based aid is so I would not hesitate to have anyone apply, see what the aid offer is, appeal if necessary and if it can’t be worked out, they do release you from ED. Therefore, it’s not really an issue.
The statistics may show that Early Decision is the way to go, but the fact that the ED applications are dropping is probably a sign that people aren’t throwing away EDs on over-reach schools any more. All athletes are told to go ED. Legacies are told to go ED. Also, minority/diversity recruits are told to go ED. Finally, the children/grandchildren of big donors and/or the children of celebrities are often told to go ED. If you aren’t in one of those categories, you’d be surprised to learn that your chances of admission are probably the same as going RD — maybe worse. ED apps are dropping because the system seems rigged. The College Admissions Scandal came up a lot when I asked fellow parents if their bright children were going to apply ED somewhere this year.
The early admission bump is misleading.
Athletes may have an 80 % admission rate, as may students with other hooks , Such as legacy, massive donations to build buildings, etc. All of whom apply early. The admission rate for the average student changes very little, which MIT is the only school honest enough to admit.
Still, there are advantages – 1 – your application is read much more carefully as there are many fewer apps 2- your application stands out more against the backdrop of athletes and legacies and 3 – if you are deferred, they KNEW it was your first choice so overall your odds end up being higher for sure. Our clients have had amazing successes in ED to schools I know they would have much less chance in during regular when the overall pool is stronger.
Georgetown’s stats were released via the Hoya. Second highest number of early applications and second lowest admit rate to MIT, lower than Harvard and others. Surprising.
I actually looked at numbers for Dartmouth and the ED admission rate when you back out legacies, questbridge, and athletes was about 11.6 percent if I recall correctly. Far less than the 25%-26% overall ED rate but still materially higher than the regular decision rate of say 6%. It was still almost twice much not 4 times or 5 times as much.
HARD TO COMPUTE EXACTLY BUT ON TOP OF HAVING 2-3 TIMES THE ODDS, YOUR FILE IS READ MUCH MORE CAREFULLY AGAINST A DIMMER BACKGROUND OF APPLICANTS WHICH ALSO GIVES A BOOST PLUS STUDENTS HAVE A CHANCE TO INDICATE THEIR FIRST CHOICE.